|
This report is develop to identify the respective share of Private well
The problem is to find out the respective share of private well mitigation cost that will
be bear by DOD and DNR under the general terms set-out in the agreement of Principle and
to develop a Cost-recovery plan based on contamination Level. We shall also focus on the
issue that if DOD is responsible for any contamination by analyzing the data set.
Methods and Procedure of
Analysis:
For analysis we have We have a Data set of 150 samples and we use it
for our analysis. By Developing a Conceptual model of the Problem we find Dependant
Variable, Contamination (CONTAM) will be influenced by, Independent Variables DBASE,
PCITY, DCITY, MCOUNT, SOIL, NLUST and DLUST. Here Soil is our dummy variable, which has 3
different types of attributes of permeability level. We exclude soil type C as we can
assign only zero and one to two types of dummy variables so in mathematical analysis we
cannot assign another zero or one to the next dummy variable as it will create fallacy.
Our Regression model i.e. (Overall Goodness of Fit) adjusted  is equal to 0.83267398. We have considered adjusted R square
because we are doing a multiple regression analysis and we have more than one Independent
variable. In our case 83.26% of Dependant Variable can be jointly explained by Independent
variables. We have check the statistical significance of our Model by F test and found it
significant by proving that at least one of the slope coefficient of Independent Variable
is not equal to zero. For checking the statistical significance of regression coefficient,
we Perform ‘t’ test. We have taken 2% of significance level to allow smaller
number of Type 1 errors in our result in order to make our analysis more accurate. By
doing that we have found that independent variables DBASE (The distance of well from the
nearest facility in miles) have no effect on Contamination of Private well along with
PCITY, DCITY, MCOUNT, and NLUST. So, there is no statistical evidence that our facilities
are not responsible for contamination of Private well within one mile, however if we plug
in zero for every Independent variables, we found some contamination to be present for the
value of intercept within DOD facility area but this can be for the presence of SOIL C,
but we can’t be held responsible for it. To make sure we run another analysis (now
with 5% significance level for ‘t’ test ) by taking samples that are within 1
mile of DOD base that is (DBASE) and found in this case that independent variable DBASE
and Intercept have no effect on contamination of Private wells. So, there is no
statistical evidence, Hence we are not responsible for any kind of contamination. ( See
attachment A). is equal to 0.83267398. We have considered adjusted R square
because we are doing a multiple regression analysis and we have more than one Independent
variable. In our case 83.26% of Dependant Variable can be jointly explained by Independent
variables. We have check the statistical significance of our Model by F test and found it
significant by proving that at least one of the slope coefficient of Independent Variable
is not equal to zero. For checking the statistical significance of regression coefficient,
we Perform ‘t’ test. We have taken 2% of significance level to allow smaller
number of Type 1 errors in our result in order to make our analysis more accurate. By
doing that we have found that independent variables DBASE (The distance of well from the
nearest facility in miles) have no effect on Contamination of Private well along with
PCITY, DCITY, MCOUNT, and NLUST. So, there is no statistical evidence that our facilities
are not responsible for contamination of Private well within one mile, however if we plug
in zero for every Independent variables, we found some contamination to be present for the
value of intercept within DOD facility area but this can be for the presence of SOIL C,
but we can’t be held responsible for it. To make sure we run another analysis (now
with 5% significance level for ‘t’ test ) by taking samples that are within 1
mile of DOD base that is (DBASE) and found in this case that independent variable DBASE
and Intercept have no effect on contamination of Private wells. So, there is no
statistical evidence, Hence we are not responsible for any kind of contamination. ( See
attachment A).
Final Recommendation:
As our contract with DNR states that we are responsible for paying
mitigation expenditure for Private wells if contamination is found within one mile of our
facilities, and as DLUST ranging from 6 miles to 44 miles we are sorry to say that we are
not responsible for contamination of ground water by our facilities and we can not be held
responsible for the permeability of soil. So, we are making note that we will not bear any
portion of the mitigation expenditure and we are consistent with which is written in our
agreement. DNR can filed another petition in the U.S. circuit court to have another
inspection.
Date: 23 November 1999
Mathematical Procedure
Multiple Regression Analysis:
Clearly Defined the Problem
The problem is to find out the respective share of private well
mitigation cost that will be bear by DOD and DNR under the general terms set-out in the
agreement of Principle and to develop a Cost-recovery plan based on contamination Level.
Develop a Conceptual model of the
Problem
Dependant Variable
{DV} |
Independent Variables {IV} |
|
Contamination (
CONTAM) will be influenced by
|
DBASE (-)
|
| |
PCITY(?)
|
| |
DCITY(-)
|
| |
MCOUNT(?)
|
| |
SOIL(?)
|
| |
NLUST(+)
|
| |
DLUST(-)
|
Operationalize Conceptual Variables
Variables |
Measurement Unit |
CONTAM |
Per million (found in each private well) |
DBASE |
Miles |
PCITY |
Number of people |
DCITY |
Miles |
MCOUNT |
Number of workers |
SOIL A |
Permeability (High) |
SOIL B |
Permeability (Medium) |
SOIL C |
permeability (Low) |
NLUST |
Number of Tanks |
DLUST |
Miles |
Create Hypothesized Regression Model
Here CONTAM i =
a + b1 DBASE i +b2 PCITY i + b3 DCITY i +
b4 MCOUNT i +b5 SOIL A i (DUMMY 1)+b6 SOIL B i (DUMMY 2) +
b7 NLUST i +b8 DLUST i +E i
Need to drop one of the categories in
" permeability " Drop C
Data Collection
We have a Data set of 150 samples of New York Private wells.
Estimate the Equation with Sample using OLS
Estimated Equation:
So, CONTAM i = 2.5 -
0.013164109 DBASE i -
0.00000067 PCITY i + 0.009343786 DCITY i +.000014 MCOUNT i +7.175801674 SOIL A i (DUMMY 1) +
3.528201968 SOIL B i (DUMMY 2) + 0.013357367 NLUST i +0.364343051 DLUST i
Statistical test on equation and Coefficients
• Regression model: Overall Goodness of Fit ( and adjusted )
R Square |
0.84165792 |
Adjusted R
Square |
0.83267398 |
We need adjusted R2 in this case because this is a multiple
regression model and Independent variable is more than 1.
So, 83.26% of Dependant Variable can be jointly explained by
Independent variables.
• Regression model: Statistical significance of the model (F
test)
HO : b1
= b2 =b3 =b4 =b5 =b6 = b7
=b8 =0
HA : bk
¹ 0
(at least one of the
Data is not equal to zero)
Test Statistics F = 93.68464387
We shall have to find the critical value
The Degree of Freedom: df = n-k- 1 = 150 - 8
-1 = 141
With 5% significance level (l)
and df=141 from the distribution of
‘F’ table
Fl, k, n-k-1 F.05, 150, 141 =
± 2
So, reject null hypothesis.
Which means at least one of the Slope coefficient of Independent
variable is not equal to zero.
• Coefficients: Statistical significance of regression
coefficients (t tests)
t’ test
From Summary
The Degree of Freedom: df = n-k- 1 = 150 - 8 -1 = 141
With 2% significance level and
df=48 from the distribution of
‘t’ table t0.005, 141 = ± 2.326
(Two tailed test).
(We are increasing 2% chance of TYPE 1 error to be committed in our
result.)
Variables |
t Stat |
Null Hypothesis |
|
Intercept |
3.060893621 |
Reject |
a¹ 0 |
DBASE |
-2.239241488 |
Not Reject |
b1=0 |
PCITY |
-0.033699455 |
Not Reject |
b2=0 |
DCITY |
0.705434013 |
Not Reject |
b3=0 |
MCOUNT |
0.573251097 |
Not Reject |
b4=0 |
SOIL A |
10.4477484 |
Reject |
b5¹ 0 |
SOIL B |
5.744312816 |
Reject |
b6¹ 0 |
NLUST |
0.41670559 |
Not Reject |
b7=0 |
DLUST |
10.57504362 |
Reject |
b8¹ 0 |
Interpret Regression Coefficient and Confidence Intervals
CONTAM i = 2.5+ 7.17 SOIL A i
+ i + 3.53 SOIL B i + 0.36 DLUST i
SOIL A i
If we increase the level of permeability by I unit, holding others IV
as constant we will increase the contamination by 7.17 in parts per million comparing to
SOIL C.
SOIL B i
If we increase the level of permeability by I unit, holding others IV
as constant we will increase the contamination by 3.53 in parts per million comparing to
SOIL C.
DLUST i
If we increase the distance of the well by I mile, holding others IV as
constant we will increase the contamination by .36 in parts per million.
If we plug zero for all the Independent variables we have contamination
level of 2.5 which is the value for intercept that means it’s due to the presence of
SOIL C.
Confidence Intervals
|
Confidence Intervals |
|
Lower 95.0% |
Upper 95.0% |
Intercept |
0.885741248 |
4.116576762 |
SOIL
A |
5.817990093 |
8.533613256 |
SOIL
B |
2.313954679 |
4.742449258 |
DLUST |
0.296231603 |
0.432454498 |
Check Regression Assumption
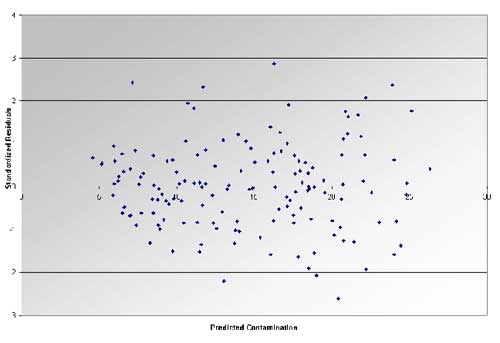
Plot predicted value and standardized residuals.
Residuals: The Scattered diagram shows heteroscedastic across the
distribution.
Conclusion
Policy Implication: We have to identify which factor has more
significant impact on Contamination level
SOIL Permeability and Distance do not have the same unit, so we cannot
compare directly and Conclude directly.
Beta (Standardized Slope Coefficient) / Conclusion
b i = bi x Sxi
/ Syi
that is Beta = Estimated Coefficient x ( Standard
Deviation of IV/ Standard Deviation of DV)
So, plugging in these number with the estimated
coefficient we will get
|
Beta (Slope
Coefficient) |
SOIL A |
0.556376545 |
SOIL B |
0.272090765 |
DLUST |
0.506085709 |
Therefore, SOIL A’s permeability level
and DLUST (The distance in miles of the well from the nearest Leaking Underground Storage
Tank) have the more influence, because their slope coefficient is higher than SOIL B.
However we should mention one thing that in our conceptual
model we treated DLUST to have negative relationship with Contamination (DV) but after Estimating
the Equation with Sample using OLS we found DLUST to have positive relationship, hence we
can conclude that the sample is somewhat biased. We may need more data to have precision.
|